Table of Contents Link to heading
Linux Kernel Link to heading
Via a shell, the kernel accepts commands from the user and manages the processes that carry out those commands by giving them access to devices, such as memory, disks, network interfaces, keyboards, mice, and monitors.
Processes Link to heading
The kernel provides access to information about active processes through a pseudo filesystem that is visible under the /proc directory.
Pseudo Filesystems Link to heading
appear to be real files on disk (a hierarchical tree off the root of the system of directories, files, and subdirectories), but in reality only exist in the system’s memory, and only appear to be resident on the storage device that the root filesystem is on.
Hardware devices are made available through a pseudo filesystem under the /dev directory, while information about those devices can be found in another pseudo filesystem under the /sys directory.
/proc Directory Link to heading
contains not only about running processes, but also information about the system hardware and the current kernel configuration.
The /proc directory is read, and its information utilised by many different
commands on the system, such as top, free, mount, and umount.
It is rarely necessary for a user to mine the /proc directory directly, usually use the commands that utilise its information.

Process ID (PID) Link to heading
assigned to each running process on the system.
init Process Link to heading
assigned a PID of 1 and started when the kernel finishes loading during boot.
On a System V-based system, the init process would be the /sbin/init program. On a systemd-based system, the /bin/systemd file is typically executed but is almost always a link to the /lib/system/systemd executable.
Regardless of which type of system init process that is being run, the information about the process can be found in the /proc/1 directory.
Process Hierarchy Link to heading
After the init process, the system starts other system processes and assigns each process a PID in sequential order.
When one process starts another process, the first process is called a parent process, labelled PPID, and the second process is called a child process.
Maximum PID Value Link to heading
configured through the /proc/sys/kernel/pid_max file; may be eventually reached when the system has been running for a long time
Once the largest PID has been used, the system “rolls over” and continues seamlessly by assigning PID values that are available at the bottom of the range.
Files under /proc Directory Link to heading
There are also a number of regular files under the /proc directory that provide information about the running kernel:
| Path/to/file | Description |
|---|---|
| /proc/bus | Contains subdirectories for installed buses. |
| /proc/bus/pci | Contains various bus subdirectories and pseudo-files containing information about PCI buses, installed devices, and device drivers. Some of these files are not ASCII. |
| /proc/bus/pci/devices | Information about PCI devices; accessed through lspci(8) and setpci(8). |
| /proc/cmdline | Arguments passed to the kernel at boot time, such as command line parameters and special instructions. |
| /proc/cpuinfo | A collection of CPU and system architecture dependent items, for each supported architecture a different list. |
| /proc/meminfo | Reports statistics about memory usage on the system; used by free(1) to report the amount of free and used memory (both physical and swap) on the system as well as the shared memory and buffers used by the kernel. |
| /proc/modules | A text list of the modules currently loaded into the kernel to add extra functionality; accessed through lsmod(8). |
Again, there is rarely a need to view these files directly, as other commands offer more user-friendly output and an alternative way to view this information.
Read more at 🔗
Files under /proc/pid Directory Link to heading
The numbered directories, corresponding to an actual process ID, contains many files and subdirectories that describe that running process, such as its configuration and use of memory.
| Path/to/file | Description |
|---|---|
| /proc/pid/cmdline | A read-only file holding the command-line arguments the process was started with. |
| /proc/pid/environ | Contains all of the process’s environment variables. |
| /proc/pid/exe | Symlink to the process’s binary magic; works even if the binary has been deleted. |
| /proc/pid/fd | Contains one entry for each file which the process has open, named by its file descriptor, and which is a symbolic link to the actual file. These symlinks are useful when user tries to recover deleted files. |
| /proc/pid/maps | List of process’s memory maps, including shared libraries, anonymous maps, etc. |
| /proc/pid/stack | The kernel’s current stack for the process; useful if it is stuck in a system call. |
| /proc/pid/status | Is the program running or asleep? How much memory is it running? And many more. |
File Modification Link to heading
While most files underneath the /proc directory cannot be modified (even by the root user) the files underneath the /proc/sys directory are potentially meant to be changed by the root user. Modifying these files changes the behaviour of the Linux kernel.
Direct modification of these files causes only temporary changes to the kernel. To make permanent changes (persistent even after rebooting), entries can be added to the appropriate section of the /etc/sysctl.conf file.
For example, the /proc/sys/net/ipv4 directory contains a file named icmp_echo_ignore_all. If that file contains a “0” character, the system will respond to icmp requests. If that file contains a “1” character, the system will not respond to icmp requests.
Viewing Processes Link to heading
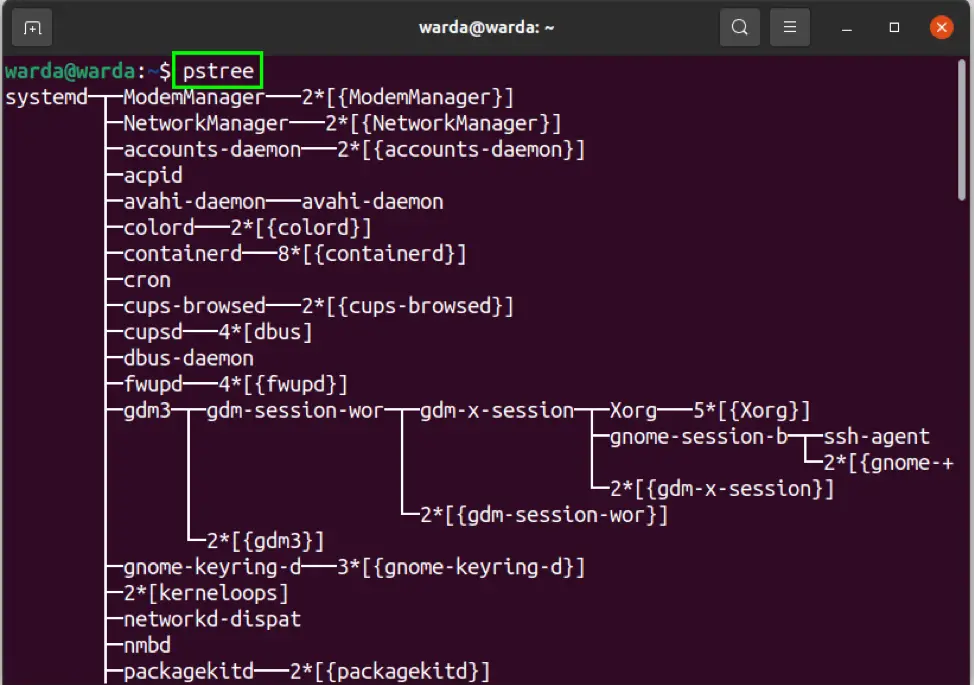
Displaying a Tree of Processes Link to heading
Processes can be “mapped” into a family tree of parent and child couplings which can be displayed via the
pstreecommand.
Use with the -p or –show-pids option to display a tree of processes with PIDs.
Viewing Process Snapshot Link to heading
Another way of viewing processes is with the
pscommand which, by default, will only show the current processes running in the current shell (including the ps command itself).
Use with the option –forest will yeild similar results to the pstree command,
albeit only in the current shell. It shows lines indicating the parent and child
relationship.
To be able to view all running processes on the system, execute either the ps aux command or the ps -ef command.
The output of the command can be filtered by the head command, so only the
first ten processes were shown.
ps -ef | head
A common way to reduce the number of lines of output that the user might have to
sort through is to use the grep command to filter the output display lines
that match a keyword, such as a process name. For example, to only view
information about the vim process:
ps -e | grep vim
Sending the output to a pager, such as the less command, can also make the
output of the ps command more manageable.
ps aux | less
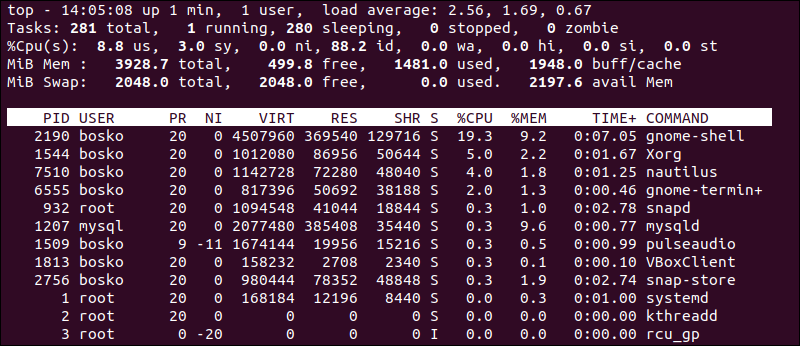
Viewing Processes in Real Time Link to heading
The
topcommand has a dynamic, screen-based interface that will regularly update the output of running processes.
By default, the output of the top command is sorted by the percentage of CPU
time that each process is currently using, with the higher values (more
CPU-intensive processes) listed first.
An administrator that is running the top command can then take one of two actions on a process:
- K key - terminates the runaway process.
- Prompts the user to provide the PID and then a signal number.
- Sending the default signal (SIGTERM) requests the process to terminate, but sending the SIGKILL signal forces the process to terminate.
- Execute the
kill -lcommand to view to list all signal names and numbers on the system.
- R key - adjusts the priority of the process.
- Prompts the user for the process to renice, and then for a niceness value (ranging from -20 to 19) which affects the process’s priority.
- Only the root user can use a niceness value that is a lower number than the current one, or a negative niceness value, which causes the process to run with an increased priority.
- Any user can provide a niceness value that is higher than the current niceness value, which causes the process to run with a lowered priority.
The load averages shown in the first line of output from the top command
indicate how busy the system has been during the last one, five, and fifteen
minutes. This information can also be viewed by executing the uptime command or
directly by displaying the contents of the /proc/loadavg file.
The /proc/loadavg file also provides two additional information:
- Number of processes - a fraction which shows the number of processes currently executing code on the CPU 1 and the total number of processes 254.
- Last PID - the last PID value that executed code on the CPU.
Memory Link to heading
governed and managed by the kernel.
Hardware/Main Memory Link to heading
shared by all the processes on the system, through a method called virtual addressing.
Physical/Random-Access Memory (RAM) Link to heading
referenced by a number of processes, any of which may think they are able to address more memory than they actually can.
Virtual Addressing Link to heading
allows many processes to access the same memory without conflicts or crashes.
It does this by allocating certain areas of a physical (or virtual) hard disk to be used in place of physical RAM. Memory is divided into blocks of equally sized units that can be addressed like any other resource on the system.
Not only can the system access memory from local system addresses, but it can also access memory that is located elsewhere, such as on a different computer, a virtual device, or even on a volume that is physically located on another continent.
Kernel Space Link to heading
where code for the kernel is stored and executed.
This is generally in a “protected” range of memory addresses and remains isolated from other processes with lower privileges.
User Space Link to heading
available to users and programs.
They communicate with the Kernel through “system call” APIs that act as intermediaries between regular programs and the Kernel.
This system of separating potentially unstable or malicious programs from the critical work of the Kernel is what gives Linux systems the stability and resilience that application developers rely on.
Viewing Memory Link to heading
Executing the free command without any options provides a snapshot of the memory being used at that moment.

Use with the -s option (how often to update) and specify that number of seconds. For example, executing the following free command would update the output every ten seconds:
free -s 10
To make it easier to interpret what the free command is outputting (default, bytes), the -m or -g options can be useful by showing the output in either Megabytes or Gigabytes, respectively.
If the amount of memory and swap that is available becomes very low, then the
system will begin to automatically terminate processes, making it critical to
monitor the system’s memory usage. An administrator that notices the system
becoming low on free memory can use top or kill to terminate the processes
of their own choice, rather than letting the system choose
Reading Output Link to heading
Descriptive Header: Link to heading
total used free shared buffers cached
Physical Memory Statistics: Link to heading
Mem: 32953528 26171772 6781756 0 4136 22660364
Memory Adjustment: Link to heading
represents the amount of physical memory after adjusting those values by not taking into account any memory that is in use by the kernel for buffers and caches.
Technically, this “used” memory that could be “reclaimed” if needed:
*/+ buffers/cache: 3507272 29446256
Swap Memory: Link to heading
refers to swap memory, also known as virtual memory. This is space on the hard disk that is used like physical memory when the amount of physical memory becomes low.
Effectively, this makes it seem that the system has more memory than it does, but using swap space can also slow down the system:
Swap: 0 0 0
Log Files Link to heading
produced by the kernel and processes running on the system that describes how they are running; useful for troubleshooting problems and determining whether or not unauthorised access has been attempted.
Some of this output is displayed as standard output and error in the terminal window where the process was executed, though some of this data is not sent to the screen. Instead, it is written to various files, called log data or log messages.
Syslog Link to heading
used almost generically to describe logging in Linux systems as it has been in place quite some time.
In some cases, when an author says syslog what they really mean is whatever logging system is currently in use on this distribution.
Logging Daemons Link to heading
Some processes can log their own data to these files, other processes rely on a separate process (a daemon) to handle these log data files.
The older method of doing system logging is two daemons (named syslogd and
klogd) working together, but in more recent distributions, a single service
named rsyslogd combines these two functions and more into a single daemon.
In yet more recent distributions, those based on systemd, the logging daemon
is named journald, and the logs are designed to allow for mainly text
output, but also binary. The standard method for viewing journald-based logs is
to use the journalctl command.
/var/log Directory Link to heading
stores all log files regardless of what the daemon process being used.
Although some of the file names may vary, here are some of the more common files to be found in this directory:
| File | Contents |
|---|---|
| boot.log | Messages generated as services are started during the startup of the system. |
| cron | Messages generated by the crond daemon for jobs to be executed on a recurring basis. |
| dmesg | Messages generated by the kernel during system boot up. |
| maillog | Messages produced by the mail daemon for e-mail messages sent or received. |
| messages | Messages from the kernel and other processes that don’t belong elsewhere. Sometimes named syslog instead of messages after the daemon that writes this file. |
| secure | Messages from processes that required authorisation or authentication (such as the login process). |
| journal | Messages from the default configuration of the systemd-journald.service; can be configured in the /etc/journald.conf file amongst other places. |
| Xorg.0.log | Messages from the X Windows (GUI) server. |
Viewing Log Files Link to heading
As with most other files, log files can be viewed using the cat command, or
the less command to allow for searching, scrolling and other options.
Another method is to use the journalctl command on systemd-based systems,
mainly because the /var/log/journal file now often contains binary information
and using the cat or less commands may produce confusing screen behaviour
from control codes and binary items in the log files.
Rotating Log Files Link to heading
Log files are rotated, meaning older log files are renamed and replaced with newer log files.
The file names that appear in the table above may have a numeric or date suffix added to them (e.g., secure.0 or secure-20181103).
Rotating a log file typically occurs on a regularly-scheduled basis (e.g. once a week). When a log file is rotated, the system stops writing to the log file and adds a suffix to it. Then a new file with the original name is created, and the logging process continues using this new file.
With most modern daemons, a date suffix is used. So, at the end of the week ending July 3, 2002, the logging daemon might stop writing to /var/log/messages (or /var/log/journal), rename that file /var/log/messages-20020703, and then begin writing to a new /var/log/messages file.
Determining Filetypes Link to heading
Although most log files contain text as their contents, which can be viewed safely with many tools, other files such as the /var/log/btmp and /var/log/wtmp files contain binary.
By using the file command, users can check the file content type before they
view it to make sure that it is safe to view. If the file command classifies a
file as data (e.g. /var/log/wtmp), it usually means the file is binary:
For the files that contain binary data, there are commands available that will
read the files, interpret their contents and then output text. For example, the
lastb and last commands can be used to view the /var/log/btmp and
/var/log/wtmp files, respectively.
The lastb requires root privileges to be executed in virtual machine
environment.
Kernel Messages Link to heading
Kernel messages can be found in the following files:
- /var/log/dmesg - contains the kernel messages that were produced during system startup.
- /var/log/messages - will contain kernel messages that are produced as the system is running.
Configuring Default Location Link to heading
Although the kernel does not have its own log file normally, one can be configured for it by modifying either the /etc/syslog.conf file or the /etc/rsyslog.conf file.
Viewing Kernel Messages Link to heading
The
dmesgcommand can be used to view the kernel ring buffer, which holds a large number of messages that are generated by the kernel.
Executing the dmesg command can produce up to 512 kilobytes of text, so
filtering the command with a pipe to another command like less or grep is
recommended.
For example, if a user were troubleshooting problems with a USB device, then searching for the text USB with the grep command is helpful. The -i option is used to ignore case.
dmesg | grep -i usb